#LookItUp: Changes in unusually hot days in the U.S.

The US has a lot of long-term weather records, so it’s a good place to study how climate change is making everything hotter. For instance, NOAA defines “unusually hot” weather as a day when the temperature rises above the 95th percentile for that location over 1948 to 2023, meaning it’s in the top 5 percent of days. And what with relentless global warming, unusually hot weather must be becoming more and more common. But why speculate when we can #LookItUp? And we encourage you to do so because if we told you what the record shows without providing evidence, you might not believe us.
This map summarizes the changes by location across the U.S. (click here and select Figure 3):
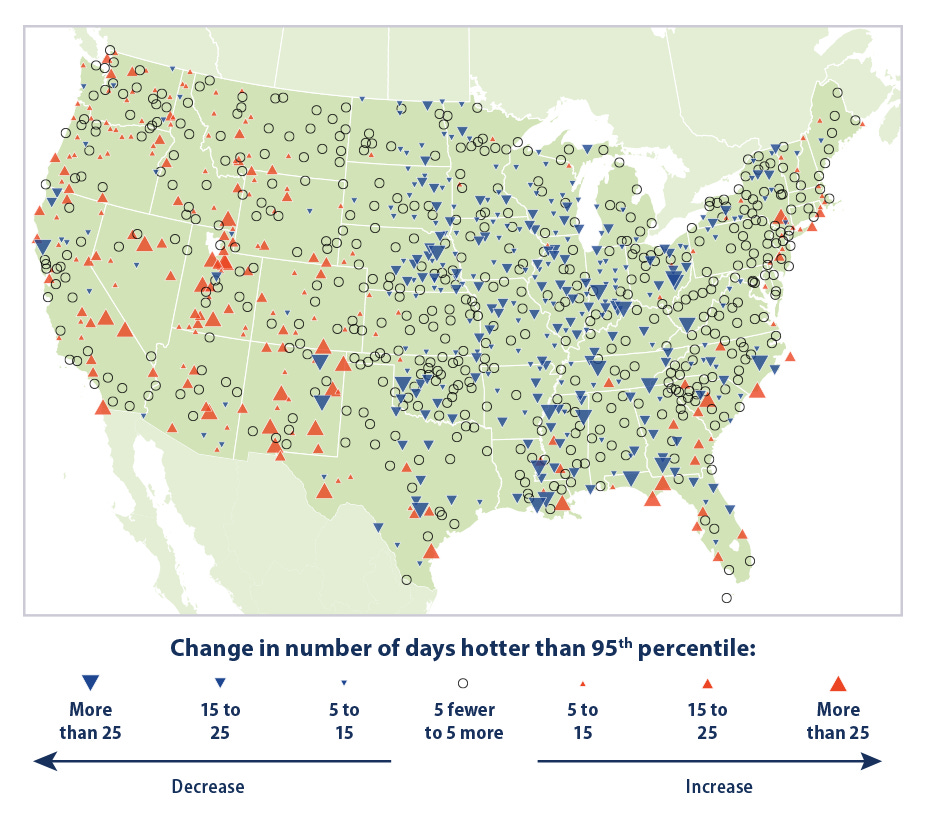
The red up arrows show where unusually hot days are becoming more common and the blue down arrows where they are becoming less common. The open circles are where there is no change. Notice anything? Right. There are a lot more blue arrows than red ones. From 1948 to 2023, unusually hot weather became less common in more places in the US (mainly east of the Rockies) than it became more common. And it’s not just that more places saw a decrease in such days, as another map at the same site shows, across the U.S., the total number of unusually hot days fell. The average change across all locations is negative. So unusually hot weather is a bit less common now overall.
Which might seem unusual if you get all your information from the alarmist media. But not once you learn that there’s a world of data out there and you know where to #LookItUp.